Census Reporter is an independent project to make it easier for journalists to write stories using information from the U.S. Census bureau. Place profiles and comparison pages provide a friendly interface for navigating data, including visualizations for a more useful first look.
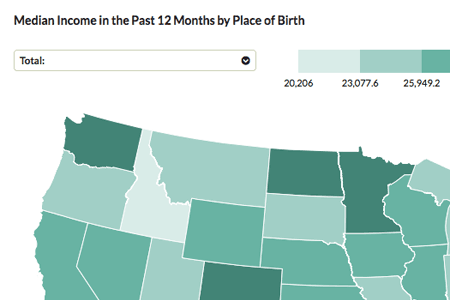 How does median income compare from state to state? More →
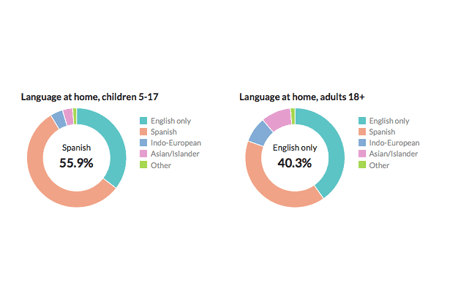 What languages do people speak at home in Los Angeles? More →
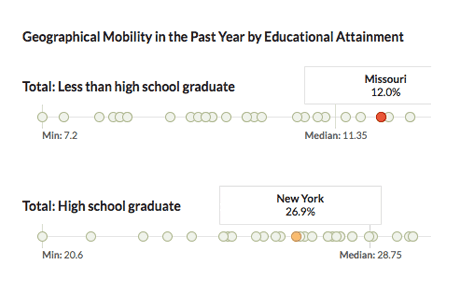 Where are people most mobile, and what skills do they have? More →
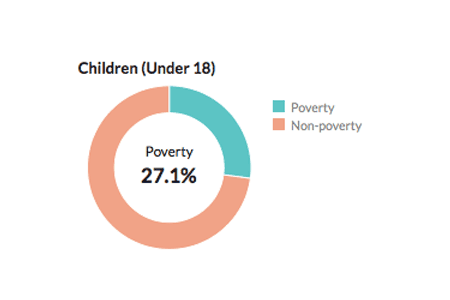 How many children live in poverty in Spokane, Wash.? More →
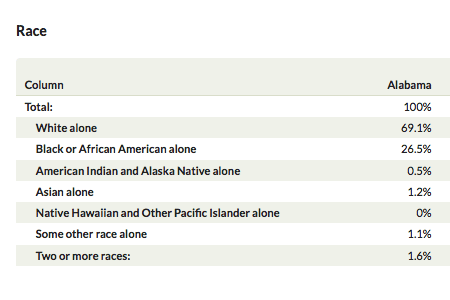 What is the racial makeup of the U.S., and how do states compare? More →
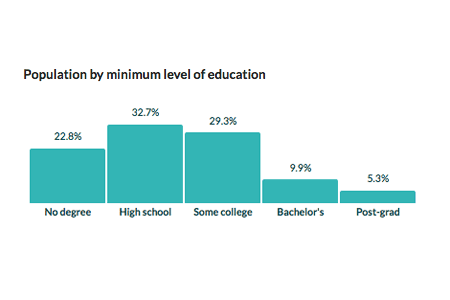 How many people have college degrees in Cleveland? More →
Learn more about the concepts and tables covered by the Census and American Community Survey. We want to help you use this data better, so let us know if there are topics you’d like to see us explain.